
Products You May Like

(Photo by Alex Tai)
SOPA Images/LightRocket via Getty Images
Bank of America (BAC), Citigroup
C
, JPMorgan Chase
JPM
and Wells Fargo
WFC
are the four money center banks considered too big to fail. Most analysts on Wall Street recommended these banks as 2020 began. I disagreed with this call given the high probability that the big banks face defaults on loans due to the Covid-19 pandemic.
One category of stress is in commercial real estate loans. Retail stores have been closing as shoppers stay at home and buy goods and services online. In addition, hotels are operating with low occupancy rates. When rental income declines below loan payments banks get squeezed.
Here’s the Scorecard for the Four ‘Too Big to Fail’ Money Center Banks
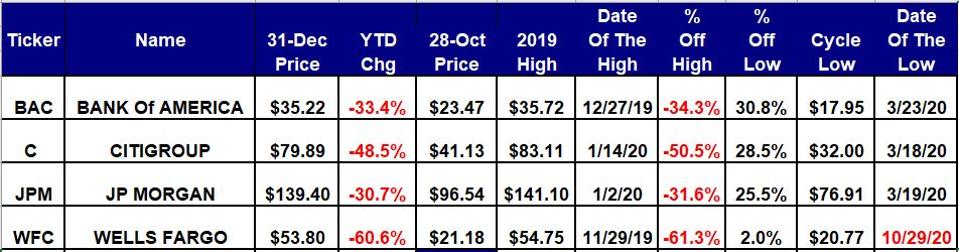
The too big to fail money center banks
Global Market Consultants
Bank of America is trading below its 50-day and 200-day simple moving averages in what’s called a death cross. Strength has stalled at or below its 200-day SMA since June 5 when the average was $28.93. BofA has a negative weekly chart with the stock below its five-week modified moving average at $24.55. It’s also below its 200-week simple moving average or reversion to the mean at $27.56. Its weekly value level is $22.84 with a quarterly pivot at $23.60 and semiannual and annual risky levels at $40.16 and $40.80, respectively.
Citigroup is trading below its 50-day and 200-day simple moving averages in a death cross pattern. Strength has stalled below its 200-day SMA since June 5 when the average was $64.25. Citi has a negative but oversold weekly chart with the stock below its five-week modified moving average at $44.90. It’s well below its 200-week simple moving average or reversion to the mean at $64.55. Its weekly value level is $34.96 with a quarterly pivot at $42.20 and semiannual and annual risky levels at $84.68 and $94.40, respectively.
JPMorgan is trading below its 50-day and 200-day simple moving averages in a death cross pattern. Strength has stalled at or below its 200-day SMA since June 5 when the average was $116.09. The stock failed to hold its 200-day SMA at 103.20 on October 26. JPM has a neutral weekly chart with the stock below its five-week modified moving average at $99.63. It’s also below its 200-week simple moving average or reversion to the mean at $105.31. The neutral reading is caused by a rising 12-week slow stochastic reading. Its weekly value level is $96.02 with a quarterly pivot at $97.02 and semiannual and annual risky levels at $143.59 and $144.69, respectively.
Wells Fargo is trading well below its 50-day and 200-day simple moving averages in a death cross pattern. The stock is trading near its 52-week low and has been well below its 200-day SMA now at $29.54. WFC has a negative weekly chart with the stock below its five-week modified moving average at $23.48. It’s well below its 200-week simple moving average or reversion to the mean at $48.13. Its monthly value level is $19.25 with a quarterly pivot at $24.61 and semiannual and annual risky levels at $47.12 and $74.27, respectively.
How to use my value levels and risky levels:
The closes on December 31, 2019 were inputs to my proprietary analytics. The annual level remains on the charts. The semiannual level was based upon the input of the June 30 close. The fourth quarter 2020 level was established based upon the September 30 close. The monthly level for October was established based upon the September 30 close.
New weekly levels are calculated after the end of each week. New quarterly levels occur at the end of each quarter. Semiannual levels are updated at mid-year. Annual levels are in play all year long.
My theory is that nine years of volatility between closes are enough to assume that all possible bullish or bearish events for the stock are factored in. To capture share price volatility investors should buy on weakness to a value level and reduce holdings on strength to a risky level. A pivot is a value level or risky level that was violated within its time horizon. Pivots act as magnets that have a high probability of being tested again before its time horizon expires.
How to use 12x3x3 Weekly Slow Stochastic Readings:
My choice of using 12x3x3 weekly slow stochastic readings was based upon back-testing many methods of reading share-price momentum with the objective of finding the combination that resulted in the fewest false signals. I did this following the stock market crash of 1987, so I have been happy with the results for more than 30 years.
The stochastic reading covers the last 12 weeks of highs, lows and closes for the stock. There is a raw calculation of the differences between the highest high and lowest low versus the closes. These levels are modified to a fast reading and a slow reading and I found that the slow reading worked the best.
The stochastic reading scales between 00.00 and 100.00 with readings above 80.00 considered overbought and readings below 20.00 considered oversold. A reading above 90.00 is considered an “inflating parabolic bubble” formation that is typically followed by a decline of 10% to 20% over the next three to five months. A reading below 10.00 is considered as being “too cheap to ignore” which typically is followed by gains of 10% to 20% over the next three to five months.
Disclosure: The author has no positions in any stocks mentioned and no plans to initiate any positions within the next 72 hours.